
Today, more than 57 million companies are on LinkedIn, so it is important for businesses to develop an effective LinkedIn marketing strategy.
One of the biggest debates we hear from LinkedIn fans who are determined to break the social network’s algorithm is whether or not to place a link in the original post or in the comments. In other words, does LinkedIn’s algorithm favour posts that don’t link off the platform?
Social Insider (who Caspia uses to track social activity and content for clients, worked with Lightspan Digital, a digital marketing agency in Chicago, in an effort to shed some light on this.
Key findings
- LinkedIn posts with no links perform better
- Most brands on LinkedIn don’t usually post links in comments
- The most common type of content on LinkedIn is an image with an engagement rate per post of 0.45%
1. Posts with no links generally perform better across all types of posts on LinkedIn
LinkedIn analysis has shown that posts with no links perform better across all types of posts.

For example, a single image posted on LinkedIn with no link can get an engagement rate that’s 70% higher than a post with an image and a link. We define engagement as the measurable interaction on LinkedIn posts, including likes, comments, and shares. The engagement rate is calculated based on all these interactions divided by the total follower count.
While many rumours circulate on the internet, such as how LinkedIn punishes posts which have links in the first comment, the truth is there is no recipe for success. It’s a trial and error type of situation until you find what works best for your LinkedIn strategy, but try posting on LinkedIn with no links and you might be surprised by the results.
Let’s see where brands stand when it comes to posting on LinkedIn with the link in the first comment.
2. Brands with a LinkedIn presence don’t usually post links in comments
To see what type of social media behavior brands have on LinkedIn, we analysed 86,504 LinkedIn posts from 883 LinkedIn pages and the results were surprising.
Our LinkedIn analysis indicates that 99.8% of companies that use LinkedIn for business don’t usually place links in comments.
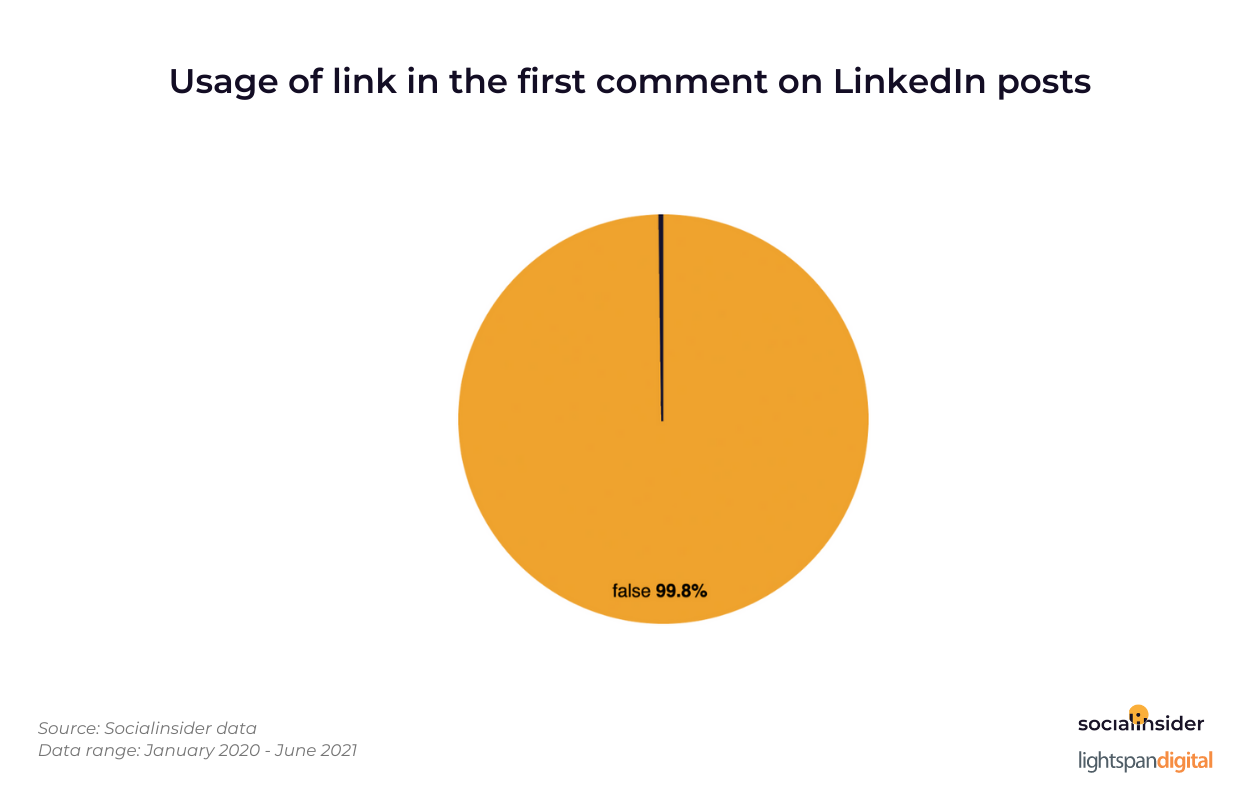
This could be explained based on the fact that most brands are using scheduling tools which limit their options to add the links in the first comments of the LinkedIn posts.
3. The best performing type of content on LinkedIn is image with an engagement rate per post of 0.45%
There is no secret that people are avid consumers of visual content. Humans are naturally drawn to anything visual because it beats our short attention span and it stimulates our minds.
Just like in Facebook’s case, visual content has taken a significant upwards turn on LinkedIn because as a consequence of the lack of time, people usually prefer seeing rather than reading.
As our previous LinkedIn study has demonstrated, images are the go-to type of posts brands use on LinkedIn, with a percentage of 49%, followed by articles, with 38%.
LinkedIn analysis determined that the most common type of content on LinkedIn is an image with an engagement rate per post of 0.45%.

Simply adding just the text with no link, a video, or a link doesn’t increase your chances of getting higher engagement from your LinkedIn content.
So, next time when you want to post something on LinkedIn, try visually-oriented content, whether it be infographics, photographs, quotes, or carousels.
C. Methodology
To identify the best strategy for LinkedIn content, we analyzed more than 86,504 LinkedIn posts from a total of 883 LinkedIn pages that had an active presence on LinkedIn between January 2020 and June 2021. These pages had LinkedIn followers counts between 100 and over 100K as of the same date.
We define engagement as the measurable interaction on LinkedIn posts, including likes, comments, and shares. The engagement rate is calculated based on all these interactions divided by the total follower count.
The LinkedIn data was also analyzed based on page size, defined as the total number of followers that liked the business pages from the Socialinsider database.
We used Socialinsider to find out the engagement rates, the type of postings, and the link placement on LinkedIn.
Below are the categories of LinkedIn posts that were analyzed in this case study:
- Article – represents content that contains articles
- Image – represents content that contains images
- Job – represents content that contains jobs
- Native document (PDF) – represents content of document file types (most of the time these are PDFs) that are uploaded natively
- Text – represents content that does not contain any media
- Video – represents content that contains videos